SAP_Dynatrace
Dynatrace
test
Introduction
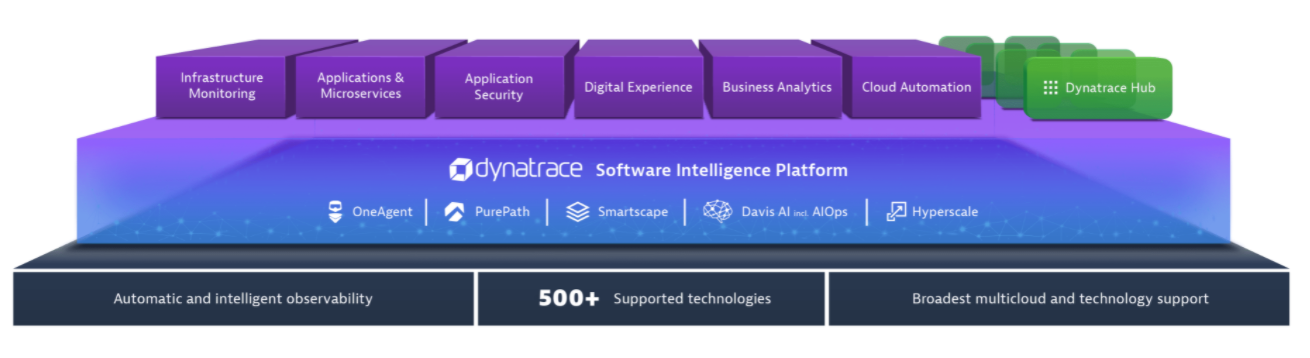
It’s a software-intelligence monitoring platform that simplifies enterprise cloud complexity and accelerates digital transformation. With Davis (the Dynatrace AI causation engine) and complete automation, the Dynatrace all-in-one platform provides answers, not just data, about the performance of your applications, their underlying infrastructure, and the experience of your end users.
Dynatrace capabilities
-
Real User Monitoring
- Real User Monitoring analyzes the performance of all user interactions with your applications, whether the interactions take place in a browser or on a mobile device. Real User Monitoring also enables application availability monitoring, verification of correct display of UI elements, third-party content provider performance analysis, backend service performance analysis (down to the code level), and performance analysis of all underlying infrastructure.
-
Mobile app monitoring
- Dynatrace supports Real User Monitoring for mobile apps as well. The process of monitoring the user experience of your native mobile apps is fundamentally different from monitoring browser-based web applications. This is because mobile-app monitoring involves the compilation, packaging, and shipment of a monitoring library along with your own mobile app package. The process of instrumenting your mobile apps largely depends on the platform of your mobile app. Dynatrace supports both Android and iOS platforms.
-
Server-side service monitoring
- Web applications consist of web pages that are served by web servers (for example, Apache Tomcat) and web containers (for example, Docker). The web requests that are sent to a specific Tomcat server are an example of a server-side service. Server-side services may be of various types like web services, web containers, database requests, and custom services. Dynatrace OneAgent can provide details about which applications or services interact with which other services and which services or databases a specific service calls.
-
Network,process and host monitoring
- Dynatrace enables monitoring of your entire infrastructure including your hosts, processes, and network. You can perform log monitoring and view information such as the total traffic of your network, the CPU usage of your hosts, the response time of your processes, and more. Dynatrace also provides detailed topological information so that you know, for example, which processes run on which hosts and how your processes are interconnected.
-
Cloud and virtual machine monitoring
- Dynatrace OneAgent monitors your entire stack, including private, public, and hybrid cloud environments. Whether you run on AWS, Azure, Cloud Foundry, or OpenStack, Dynatrace OneAgent auto-detects all virtualized components and keeps up with all changes. Dynatrace OneAgent can be integrated with your virtualized infrastructure, allowing you to connect the dots between the dependencies of the vCenters in your data center, the processes that run on them, and your applications.
-
Container monitoring
-
Dynatrace seamlessly integrates with existing Docker environments and automatically monitors your containerized applications and services. Dynatrace hooks into containers and provides code for injecting OneAgent into containerized processes.
There’s no need to modify your Docker images, modify run commands, or create additional containers to enable Docker monitoring. Simply install Dynatrace OneAgent on your hosts that serve containerized applications and services. Dynatrace automatically detects the creation and termination of containers and monitors the applications and services contained within those containers.
-
-
Root-cause analysis
- A key feature of Dynatrace is Davis®, the Dynatrace AI-driven causation engine. Davis® relies on artificial intelligence to continuously monitor every aspect of your applications, services, and infrastructure to automatically learn the baseline performance metrics and dependencies of all these components. Dynatrace also automatically learns the baseline response times and failure rates of the key requests that are vital to the success of your business (customer newsletter signups, customers adding items to an online shopping cart, requesting a live demo, etc) so that you can track success toward your business’ conversion goals. Problem detection and reporting is based on these baseline values. Dynatrace determines for example when a detected slowdown or error-rate increase justifies the generation of a new problem event.
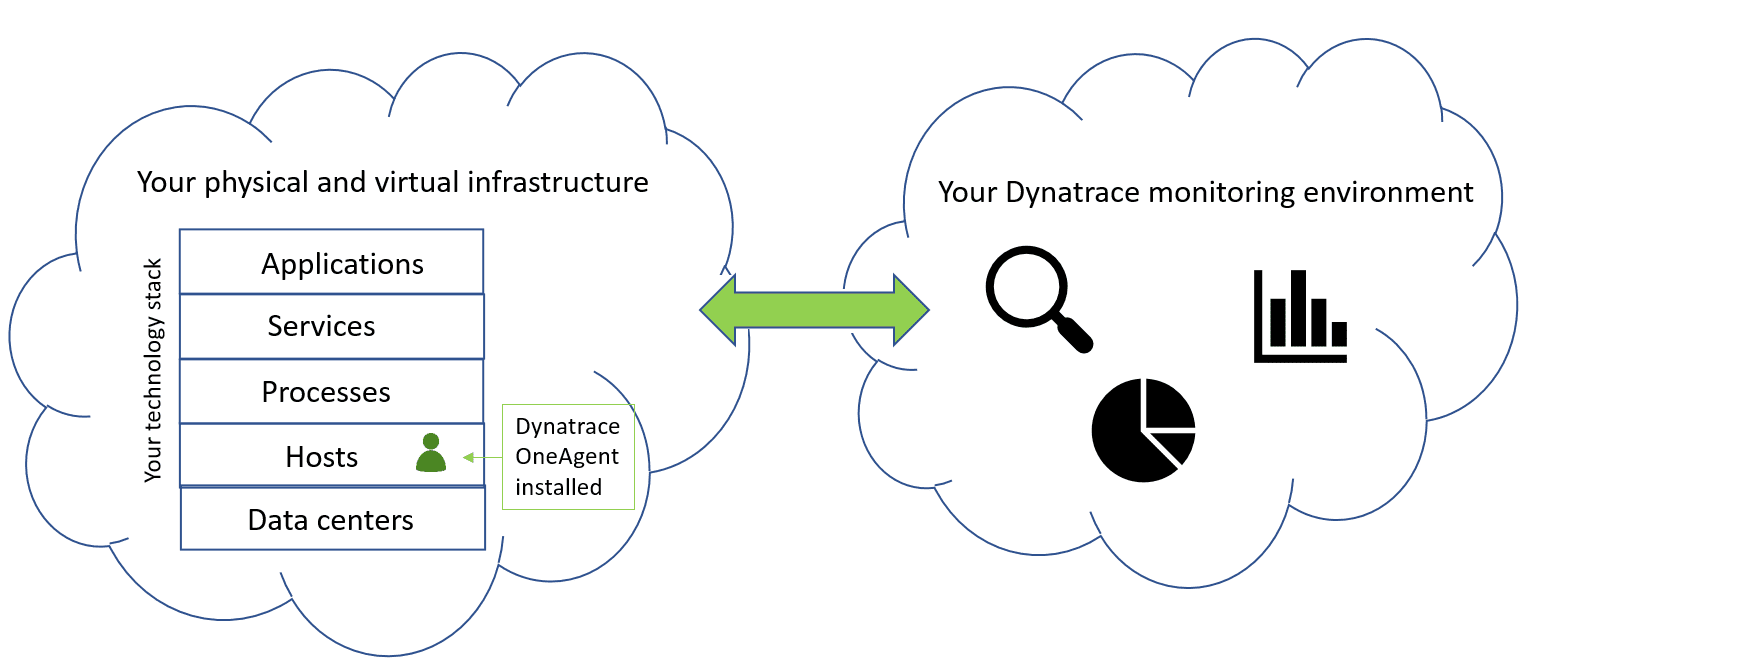
How dose Dynatrace work
-
OneAgent
- a single agent that automatically discovers, instruments, and collects high-fidelity monitoring data from everything in your IT environment.
-
Smartscape
- an interactive environment topology map that visualizes the dynamic relationships among all your application components across every tier.
-
Davis AI engine
- analyzes everything (including all relationships and dependencies within complex IT environments) to provide answers, not just data. Davis® tells you when there is a problem, the business impact of the problem, and the root cause of the problem so that you can fix it quickly, including automated remediation through integration with your CI/CD tools.
Monitoring environments
- Your monitoring environment resides in the Dynatrace cloud, unless you’re using our on-premises deployment option, Dynatrace Managed. For Dynatrace Managed customers, your monitoring environment is hosted within your own data center.

Environment ID
- All external access to your Dynatrace monitoring environment relies on two credential types: an environment ID and an access token. Each environment that you monitor with Dynatrace is identified with a unique character string—the environment ID. The Dynatrace API relies heavily on environment IDs to ensure that it pulls monitoring data from and pushes relevant external events to the correct Dynatrace environments.
- Dynatrace Saas
https://{your-environment-id}.live.dynatrace.com/ |
- Dynatrace Managed
https://{your-domain}/e/{your-environment-id}/ |
Token
- Token format
dt0c01.ST2EY72KQINMH574WMNVI7YN.G3DFPBEJYMODIDAEX454M7YWBUVEFOWKPRVMWFASS64NFH52PX6BNDVFFM572RZM |
dt0c01 |
Prefix to identify the token. |
|---|---|
ST2...7YN |
Public portion of token A 24-character public identifier of the token. This value can be safely displayed in the UI and can be used for logging purposes. |
G3D...RZM |
Secret portion of token A 64-character secret portion of the token, which can be treated like a password and therefore doesn’t need to be displayed in the Dynatrace web UI (following initial creation) or stored in log files. |
-
regular expression
dt0[a-zA-Z]{1}[0-9]{2}\.[A-Z0-9]{24}\.[A-Z0-9]{64}
-
token scope
- You can set them in the UI as described above or via the API authentication tokens API. Some scopes are only available via API.
-
Access Token
- Normally, access tokens require admin rights to generate. With personal access tokens, however, you can generate a token for API usage without admin rights. Available scopes are bound to your permissions, meaning that you can only use the API counterparts of features you’re already authorized to use. You’re also limited to the data from management zones you have access to.
-
Tenant Token
- The tenant token is used by OneAgents and ActiveGates to report data to Dynatrace. Dynatrace automatically generates the tenant token and adds it to OneAgent and ActiveGate installers on download.
- get: execute the GET connectivity information for OneAgent request of the Deployment API. You will find the tenant token in the
tenantTokenfield of the response body. You’ll need your PaaS token to authenticate the request.
Dyanatrace glossary
- Apdex
- A performance-measurement standard that shows the relationship between recorded performance measurements and real-user satisfaction. Apdex offers a uniform means of measuring how well performance meets user expectations. For full details on the Apdex standard, please visit Apdex.org. In the context of Dynatrace, Apdex is used to give you a quick and easy rating that you can use to evaluate the satisfaction of your application’s end users. Apdex ratings in Dynatrace are based on application-specific thresholds. An Apdex measurement rating of
1equates to perfect performance. An Apdex rating below0.5equates to poor performance. For more details about how Apdex is applied in Dynatrace, see Apdex ratings
- A performance-measurement standard that shows the relationship between recorded performance measurements and real-user satisfaction. Apdex offers a uniform means of measuring how well performance meets user expectations. For full details on the Apdex standard, please visit Apdex.org. In the context of Dynatrace, Apdex is used to give you a quick and easy rating that you can use to evaluate the satisfaction of your application’s end users. Apdex ratings in Dynatrace are based on application-specific thresholds. An Apdex measurement rating of
Dynatrace user interface
Install Dynatrace in WSL2
Create your Dynatrace account
-
Go to the Dynatrace website.
-
Select Free trial.
-
Enter your business email address and select Start free trial.
-
Provide a few account details (nothing too technical) and agree to the terms and conditions.
-
Select Create account.
-
You should see a welcome message something like this.
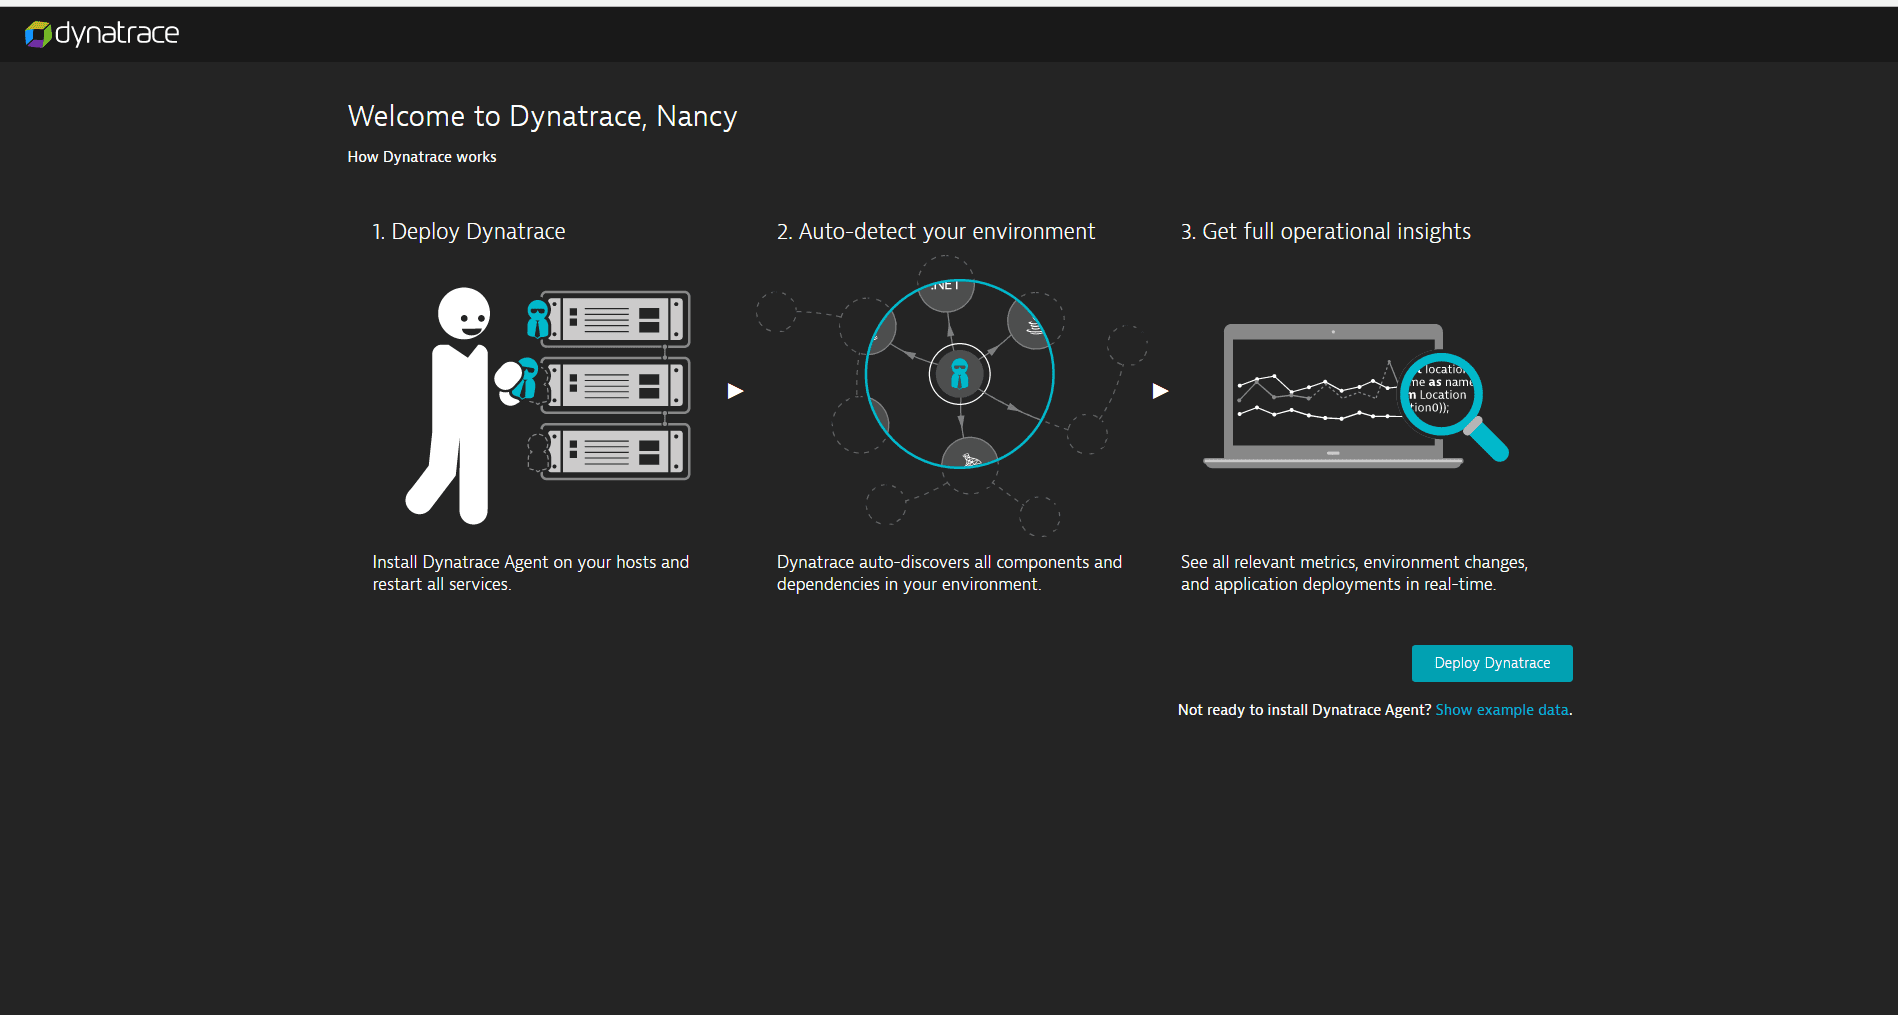
Deploy Dynatrace
-
Select Deploy Dynatrace.
-
Select Start installation.
-
Select the type of machine you are going to monitor: Windows, Linux, AIX, or Solaris.
-
Follow the on-screen instructions for getting and installing OneAgent.
-
For Windows, there are no additional parameters to provide. Just select Download OneAgent installer to download the Windows installer. When the download is finished, copy the installer to the target Windows machine and run it.
-
For other operating systems, the download page will show you the exact commands for installing the agent. Copy the command and run it on the target machine to install the agent.
-
-
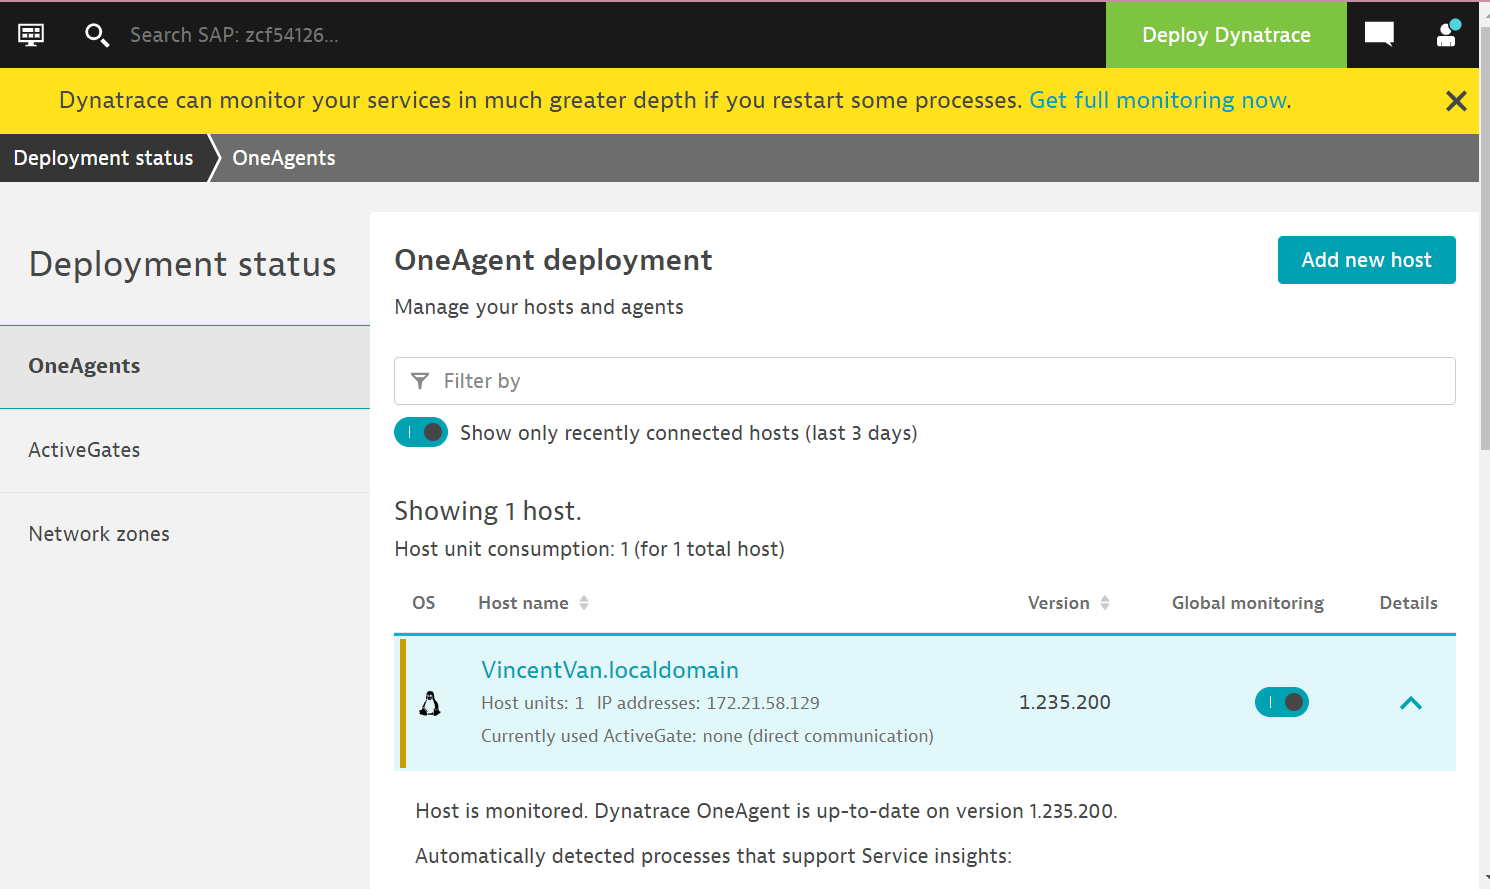
Install successfully
-
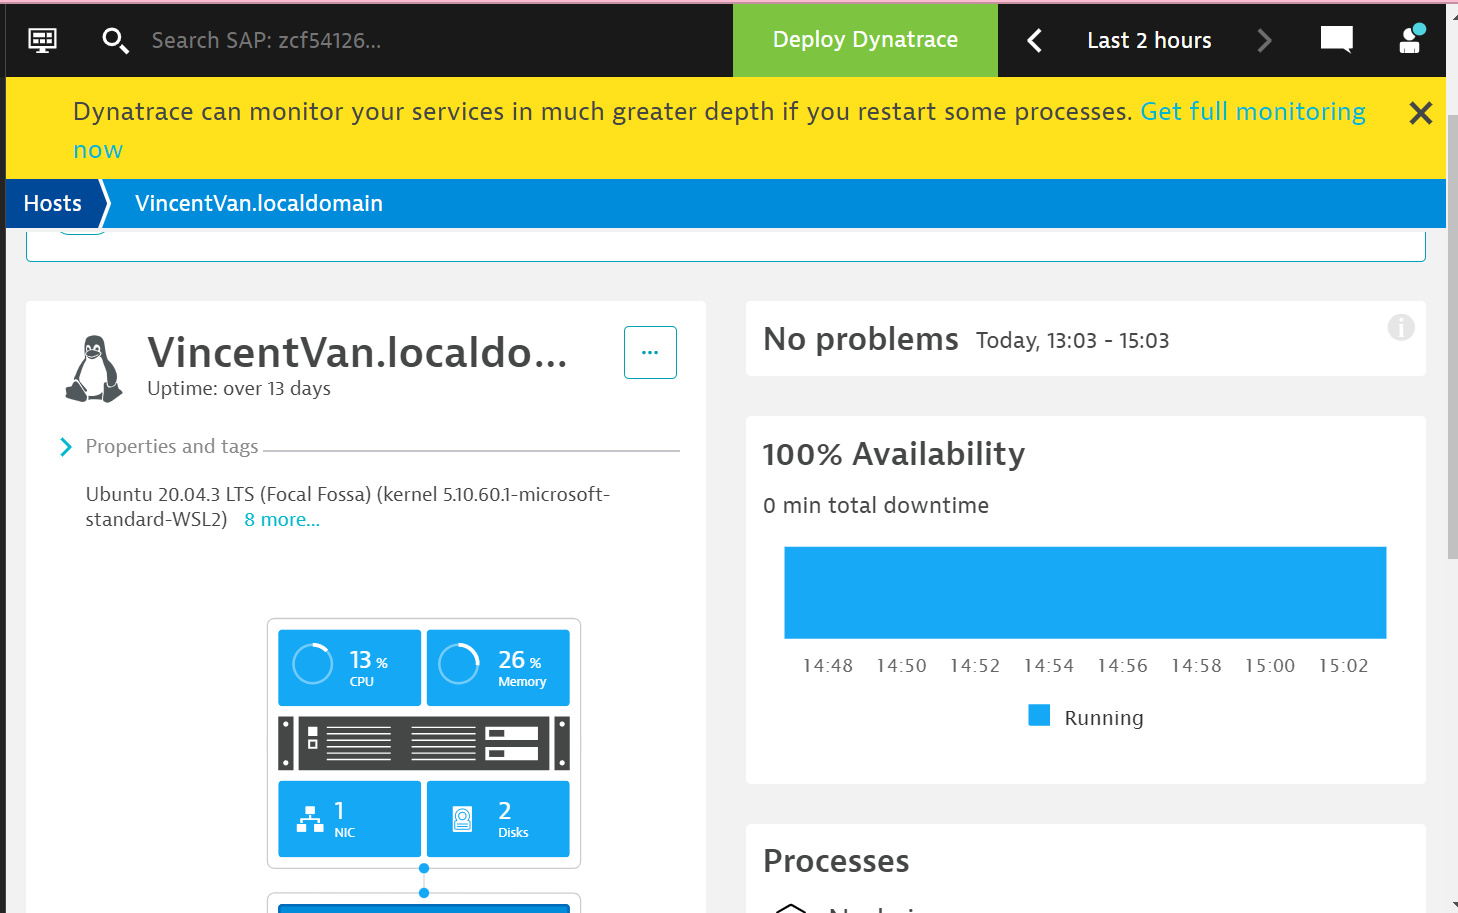
CPU,memory,NICs,and disks
In the example,you can see the CPU consumption :13%,memory consumption: 26%,number of NICs:1,number of disks:2
-
CPU:
With CPU selected (the default), you can click Consuming processes to see exactly which processes are using that memory.
-
- 微信
- 支付宝